Thesis Research Methods and Preliminary Findings
This is a blog-style outline of my ongoing thesis research, which is a mixed-methods analysis of rural transit in central Appalachia. First I’ll cover the background and historical context of mobility in Appalachia. Then I'll get into the literature review, which will include existing assessments of transit demand, accessibility, and ridership, as well as some case studies about how mobility has been expanded in places with similar characteristics to Appalachia. I’ll also discuss my methods and preliminary findings. The piece will conclude with a summary of the work I have yet to do on this project. For added context, I’ve also interspersed some images from google maps street view that I think capture the built and natural form of the region and regions with similar topographical and social characteristics.
Let’s start with some background information. Below is a map of all the federally-recognized counties in Appalachia. The red lines are corridors of the Appalachian Development Highway System, or the ADHS. The ADHS was proposed by a body called the Appalachian Regional Commission or ARC, which was created by the Kennedy administration to improve the economic and social development of the region. It’s been under construction since the 1960s and isn’t slated to be 100% complete until 2040. In true 1960s fashion, planning for the ADHS was predicated on the idea that an extensive highway system would spawn top-down economic development by ramping up extractive industries like mining and logging.

ARC counties (white) and completed ADHS corridors (red)
Using historical evidence, interview data, spatial analysis, and quantitative analysis, I hope to identify the basic characteristics of existing transportation networks in Appalachia, investigate how the ADHS has impacted planning for mobility and public transportation, and evaluate whether the ADHS has increased mobility in a socially-just way.
The overall body of work that takes a critical look at the effectiveness of the ADHS is small compared to assessments of transportation initiatives in more wealthy and populous regions. But even so, researchers have employed a handful of different modes for assessing the ADHS. The regional production function is a model used in microeconomics. Hicks (2014), using this model, found no evidence of increased economic activity among small businesses in counties adjacent to ADHS corridors. GIS modeling is probably a more familiar mode of analysis for planners. Lein and Day (2007) used a Landsat satellite to track changes in land use along a highway corridor and found that the highway might have been the cause for intensifying land uses. But, as highways tend to do, it failed to address fundamental barriers to work, housing, and health services. Finally, a mixed-methods study that combined qualitative data from interviews with on-the-ground observations and data analysis found that social services funding for the region was more integral to economic development than highway construction. Among sources separate from ARC, the highway system has not lived up to expectations.
Getting into the conditions of transit in Appalachia, the chart below shows the percentage of various kinds of institutions that are inaccessible by transit for the entire state of West Virginia. You can tell that public transit access is really lacking. The data here comes from the West Virginia Department of Transportation. In a public transportation opinion survey in an Appalachian region of South Carolina, it was found that residents wanted expanded inter-city transit connections and evening and night service to enable second and third shift workers to get to work easier. A regional study found that ridership on on-demand bus service in rural Appalachia is growing, and outperforming national and urban ridership trends. Another study emphasized Appalachia’s aging population and how integral on-demand bus service is to access to health services and everyday errands. There are numerous reports that show there is demand for transit in the region, but also lots of room for improvement.

This brings us to an overview of some of the case studies that have valuable insights about how and why to improve mobility in rural places where transit might be a tougher sell. Valenje is city of about 30,000 in a mountainous and rural region of Slovenia, surrounded by very small mining towns. A study found that a demand-responsive transit system was favored by urban and rural residents. This system addressed risks of service reduction due to low demand for fixed routes and increased the number of settlements with daily and frequent access to vital services only offered in the city. An empirical study of transit in rural Tennessee looked at the costs and benefits of operating cost-effective, demand-responsive transit service in sparsely-populated rural areas. Among the benefits were expanded user mobility, congestion mitigation, and improved safety, air quality, and transportation efficiency. In Waterland, Netherlands, the implementation of a regional, demand-responsive transit system resulted in increased system efficiency compared to fixed-route service. so, kilometres per passenger, operational costs per passenger, and GHG emissions per passenger decreased. BUT this is a cautionary tale because ridership dropped to under 28% of the fixed-route level, likely due the inconvenience associated with demand-responsive systems.

Left: Valenje, Slovenia, center: rural Tennessee, right: Waterland, Netherlands
Just to add context to the previous slide, these are some google maps street view images of the case study locations. The two on the left are from Valenje, Slovenia. Like in Appalachia, heavy rail, rugged mountain sides, and winding valleys dictate the built form. The rightmost image is of a rural bus shelter in waterland, netherlands.
Methodology
I’ve been taking a mixed-methods approach to addressing my research questions. First, i’ve drawn on interviews with transportation researchers and planning practitioners who live and work in Appalachian counties. I’ve been asking them about systemic barriers to mobility in Appalachia, whether they see a connection between those barriers and the impacts of the ADHS, and their ideas about addressing the region’s transit deficits. I’m using ATLAS.ti to code the interview data. To investigate the variables that the interviewees mention, I’m also using QGIS to conduct spatial analyses and also doing correlational analysis. Initially I wanted to collect ethnographic data as well but that has been really difficult because of the pandemic. I do think an ethnographic or user-centric component would benefit the project. I’m also limited by the lack of mode choice and mode dependence data for this region. I’ve had to use proxies, like grocery store accessibility data from the USDA Food Access Research Atlas.
The driving component of my analysis is interview data. Like I mentioned, I’ve interviewed a combination of transportation researchers and practitioners. I’ve divided the interview data findings into two groups, researchers on the left and practitioners on the right. Themes that both groups mentioned are listed in the middle section. I wanted to break the groups up to get a feel for the bigger-picture trends that researchers might be more attuned to, as well as on-the-ground issues that planners are dealing with at their agencies. This Venn diagram shows some of the key barriers that researchers and practitioners said limit mobility in Appalachia.

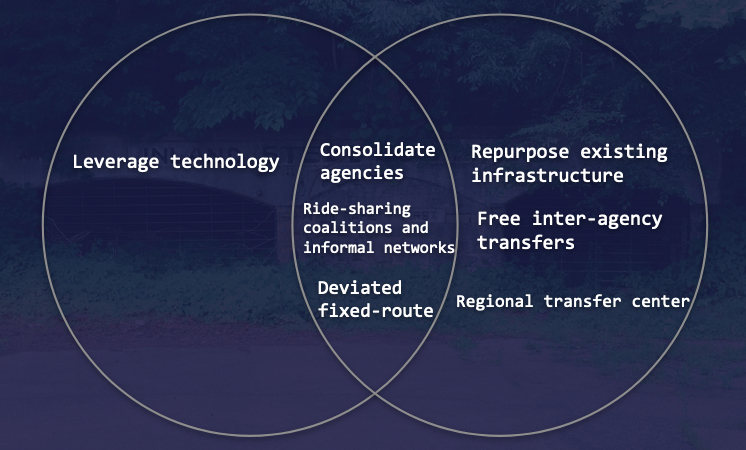
I won’t go over these individually but this Venn diagram shows solutions proposed by the two groups. I’ll highlight two solutions I’ve heard a lot so far: one is informal regional transportation networks and coalitions organized by residents. Second, practitioners are salvaging old infrastructure to set up extra bus stops and park and ride lots. And this Venn diagram shows what the two groups think the impacts of the ADHS have been on mobility and planning in the region. The big takeaway here is that the ADHS has increased mobility by personal vehicle but likely decreased opportunities for travel by other modes. I’ve used these findings to guide my quantitative and spatial analyses, which I’m going to discuss next.
For the quantitative analysis, I want to test some of the claims made by the professionals in the interviews. I’ve started by looking at population density and car-dependency rates since the interview data has pointed to those as both effects of the ADHS and barriers to improving mobility. So far I've found a strong correlation between low population density and car-dependency. I still need to test whether being in a no transit county or being near an ADHS corridor impacts that correlation.

These are some preliminary results of a spatial analysis on transit access and car dependency. I used data from the USDA food access research atlas, which actually tracks whether a census tract has more than 100 zero-vehicle households. The counties highlighted in green have the lowest proportions of zero-vehicle households in the region.
And the red counties are ones which aren’t served by public transit of any sort -- not a fixed-route system, not a deviated system, and no on-demand service. I’ve found so far that the “no transit” counties tend to be clustered around the “no zero-vehicle” counties. There are a few counties that are low zero-vehicle and no transit, but the majority of no transit counties also have relatively high proportions of zero-vehicle households. This indicates that there is a need for more extensive transit service. I plan to expand on this analysis by measuring accessibility to essential services like healthcare and grocery stores.
This is a quote from one of the interviews so far that I found really insightful.
“Something that provides access for people in this world to connect with each other or to connect outside of Appalachia also connects extraction to the rest of the world.”

Conclusion and Future Work
The main takeaway so far is that ARC’s efforts have always emphasized a top-down approach to regional success that’s defined by economic output rather than housing, health, or educational outcomes. There is evidence that this approach has actually limited mobility by inducing low densities and car dependence.